📊 Data Visualization in Accelerator
The Accelerator platform provides built-in, interactive data visualization capabilities for all validated datasets — enabling you to explore and share your data with ease, directly from the platform.
✅ Supported Dataset Types
Currently, visualization is available for:
| Dataset Type | Supported Visuals |
|---|---|
| Regional Timeseries | Bar, Stacked Bar, Line Charts |
| Raster Timeseries | High-resolution map viewer |
| Vector / Tabular Mixed | Regional map explorer |
| CSV Timeseries | (Coming soon) |
📈 Charting Regional Timeseries
For regional timeseries datasets, you can explore the data using several built-in charts:
1. Bar Chart
- Compare values across categories (e.g., region, variable)
- Supports pivoting and dimension filters

2. Stacked Bar Chart
- Compare aggregated values broken into subcomponents (e.g., emissions by sector)
- Interactive toggles and pivot options

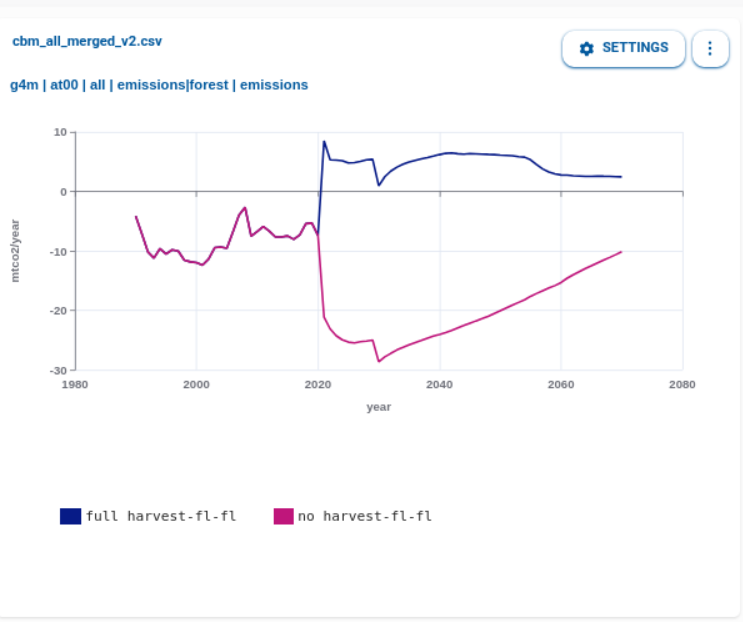
3. Line Chart
- Ideal for time series and trends
- Pivot by region, scenario, or variable
- Filter on any dimension
🗺️ Raster Timeseries Explorer
For GeoTIFF-based raster timeseries, the platform provides a high-resolution, map-based viewer:
- Time slider to animate through temporal layers
- Zoom and pan for spatial focus
- Color scale controls
- Basemap and overlay support

🌐 Embeddable Visualizations
All charts and maps generated on the platform can be embedded in third-party websites.
- Embed using iframes or shareable links
- Visualizations remain live — auto-update with data
- Access control is preserved
- Lightweight setup — no need for external charting tools
⚡ Purpose: These visualizations are meant for quick exploration and rapid sharing with collaborators or research partners.
🧩 Advanced Embeddable Components
Beyond single dataset explorers, Accelerator offers advanced embeddable components, designed for dashboards, decision-support tools, and portals.
- Compare multiple datasets dynamically
- Switch between models, variables, or scenarios
- Overlay spatial and tabular data
- Embed powerful visual UIs in web applications
These components can be customized and embedded like widgets and respect all sharing policies and user scopes.
✅ Summary
| Feature | Description |
|---|---|
| Charts for Tabular Data | Bar, stacked bar, and line charts for regional timeseries |
| High-res Map Viewer | For raster/GeoTIFF timeseries datasets |
| Embed Anywhere | Share charts via links or iframe |
| Dashboard-Ready Views | Support for multi-dataset analysis |
Accelerator visualizations help users move from data to insight quickly — with tools that scale from one-click charts to enterprise-grade dashboards.